Project 1: data visualisation
The brief for this project was to create the first of two project focused on information visualisation, specifically in the form of a static infographic.
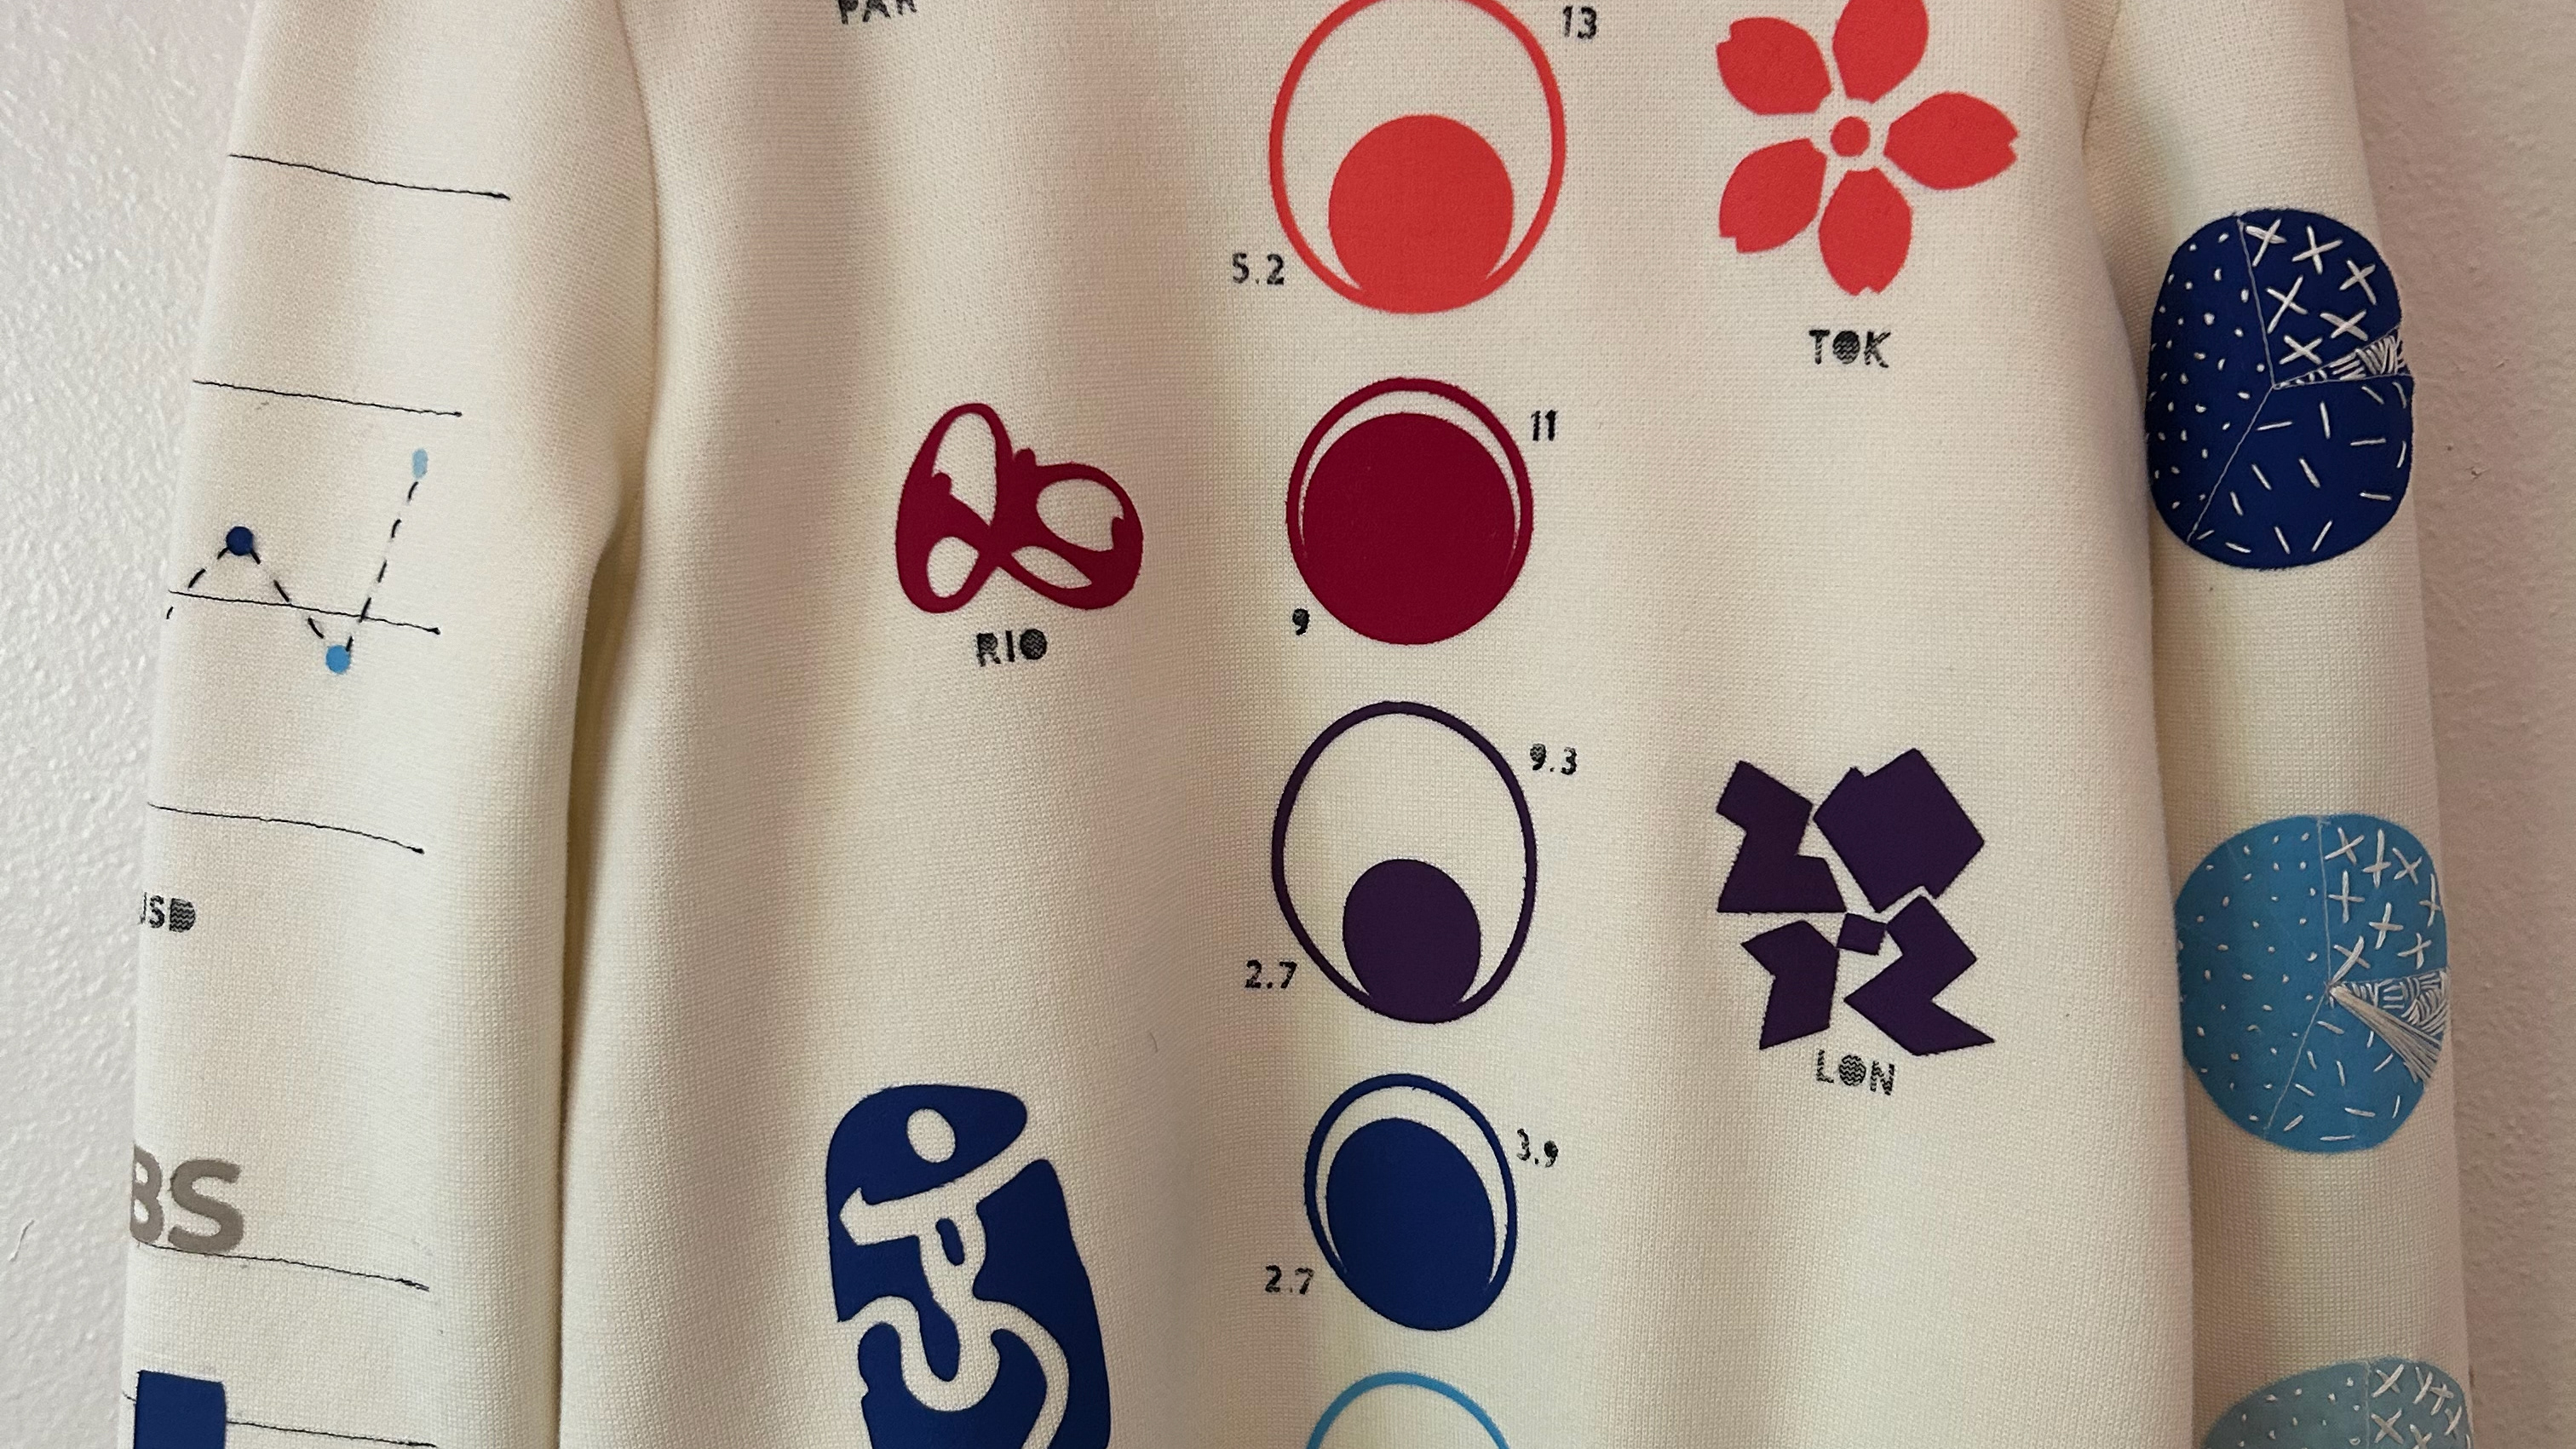
This project involved creating a data visualiSation that explores the economic impact of the Summer Olympics. The goal was to transform complex data into an engaging, static visual form.
This project involved creating a data visualiSation that explores the economic impact of the Summer Olympics. The goal was to transform complex data into an engaging, static visual form.
Inspired by E.J. Marey’s work on capturing movement, I aimed to convey the dynamic nature of Olympic sports through running and jumping figures, as well as track side perspectives. To create a sense of movement, I integrated perspective inspired by dynamic angles from track side photography.
This approach allowed the infographic to stand out from more typical, flat visualisations. This design was created using Adobe Illustrator, with detailed use of a 3D perspective tool applied to text to achieve the desired visual depth. The final design successfully conveyed a strong story telling experience through mergin


